Menu

In HMLV production it can be challenging to achieve high levels of efficiency due to the frequent changeovers and setups required for producing different products. A production dashboard is a valuable tool for managers helping to control production by monitoring Key Performance Indicators (KPIs) from the top level. We identified 4 main KPIs managers should monitor to gain more efficiency and profitability.
First of all, everyone in a job shop knows a planning board, whether it is a physical board, or is created with Excel, or generated via scheduling software. However, only a few of the small companies use a dashboard to monitor production from a higher level. Many find the effort involved in creating and maintaining an additional planning tool too high, are far too busy with day-to-day operations, and see too little added value in a dashboard.
The added value of a dashboard becomes clear when you consider the differences between a planning board and a dashboard.
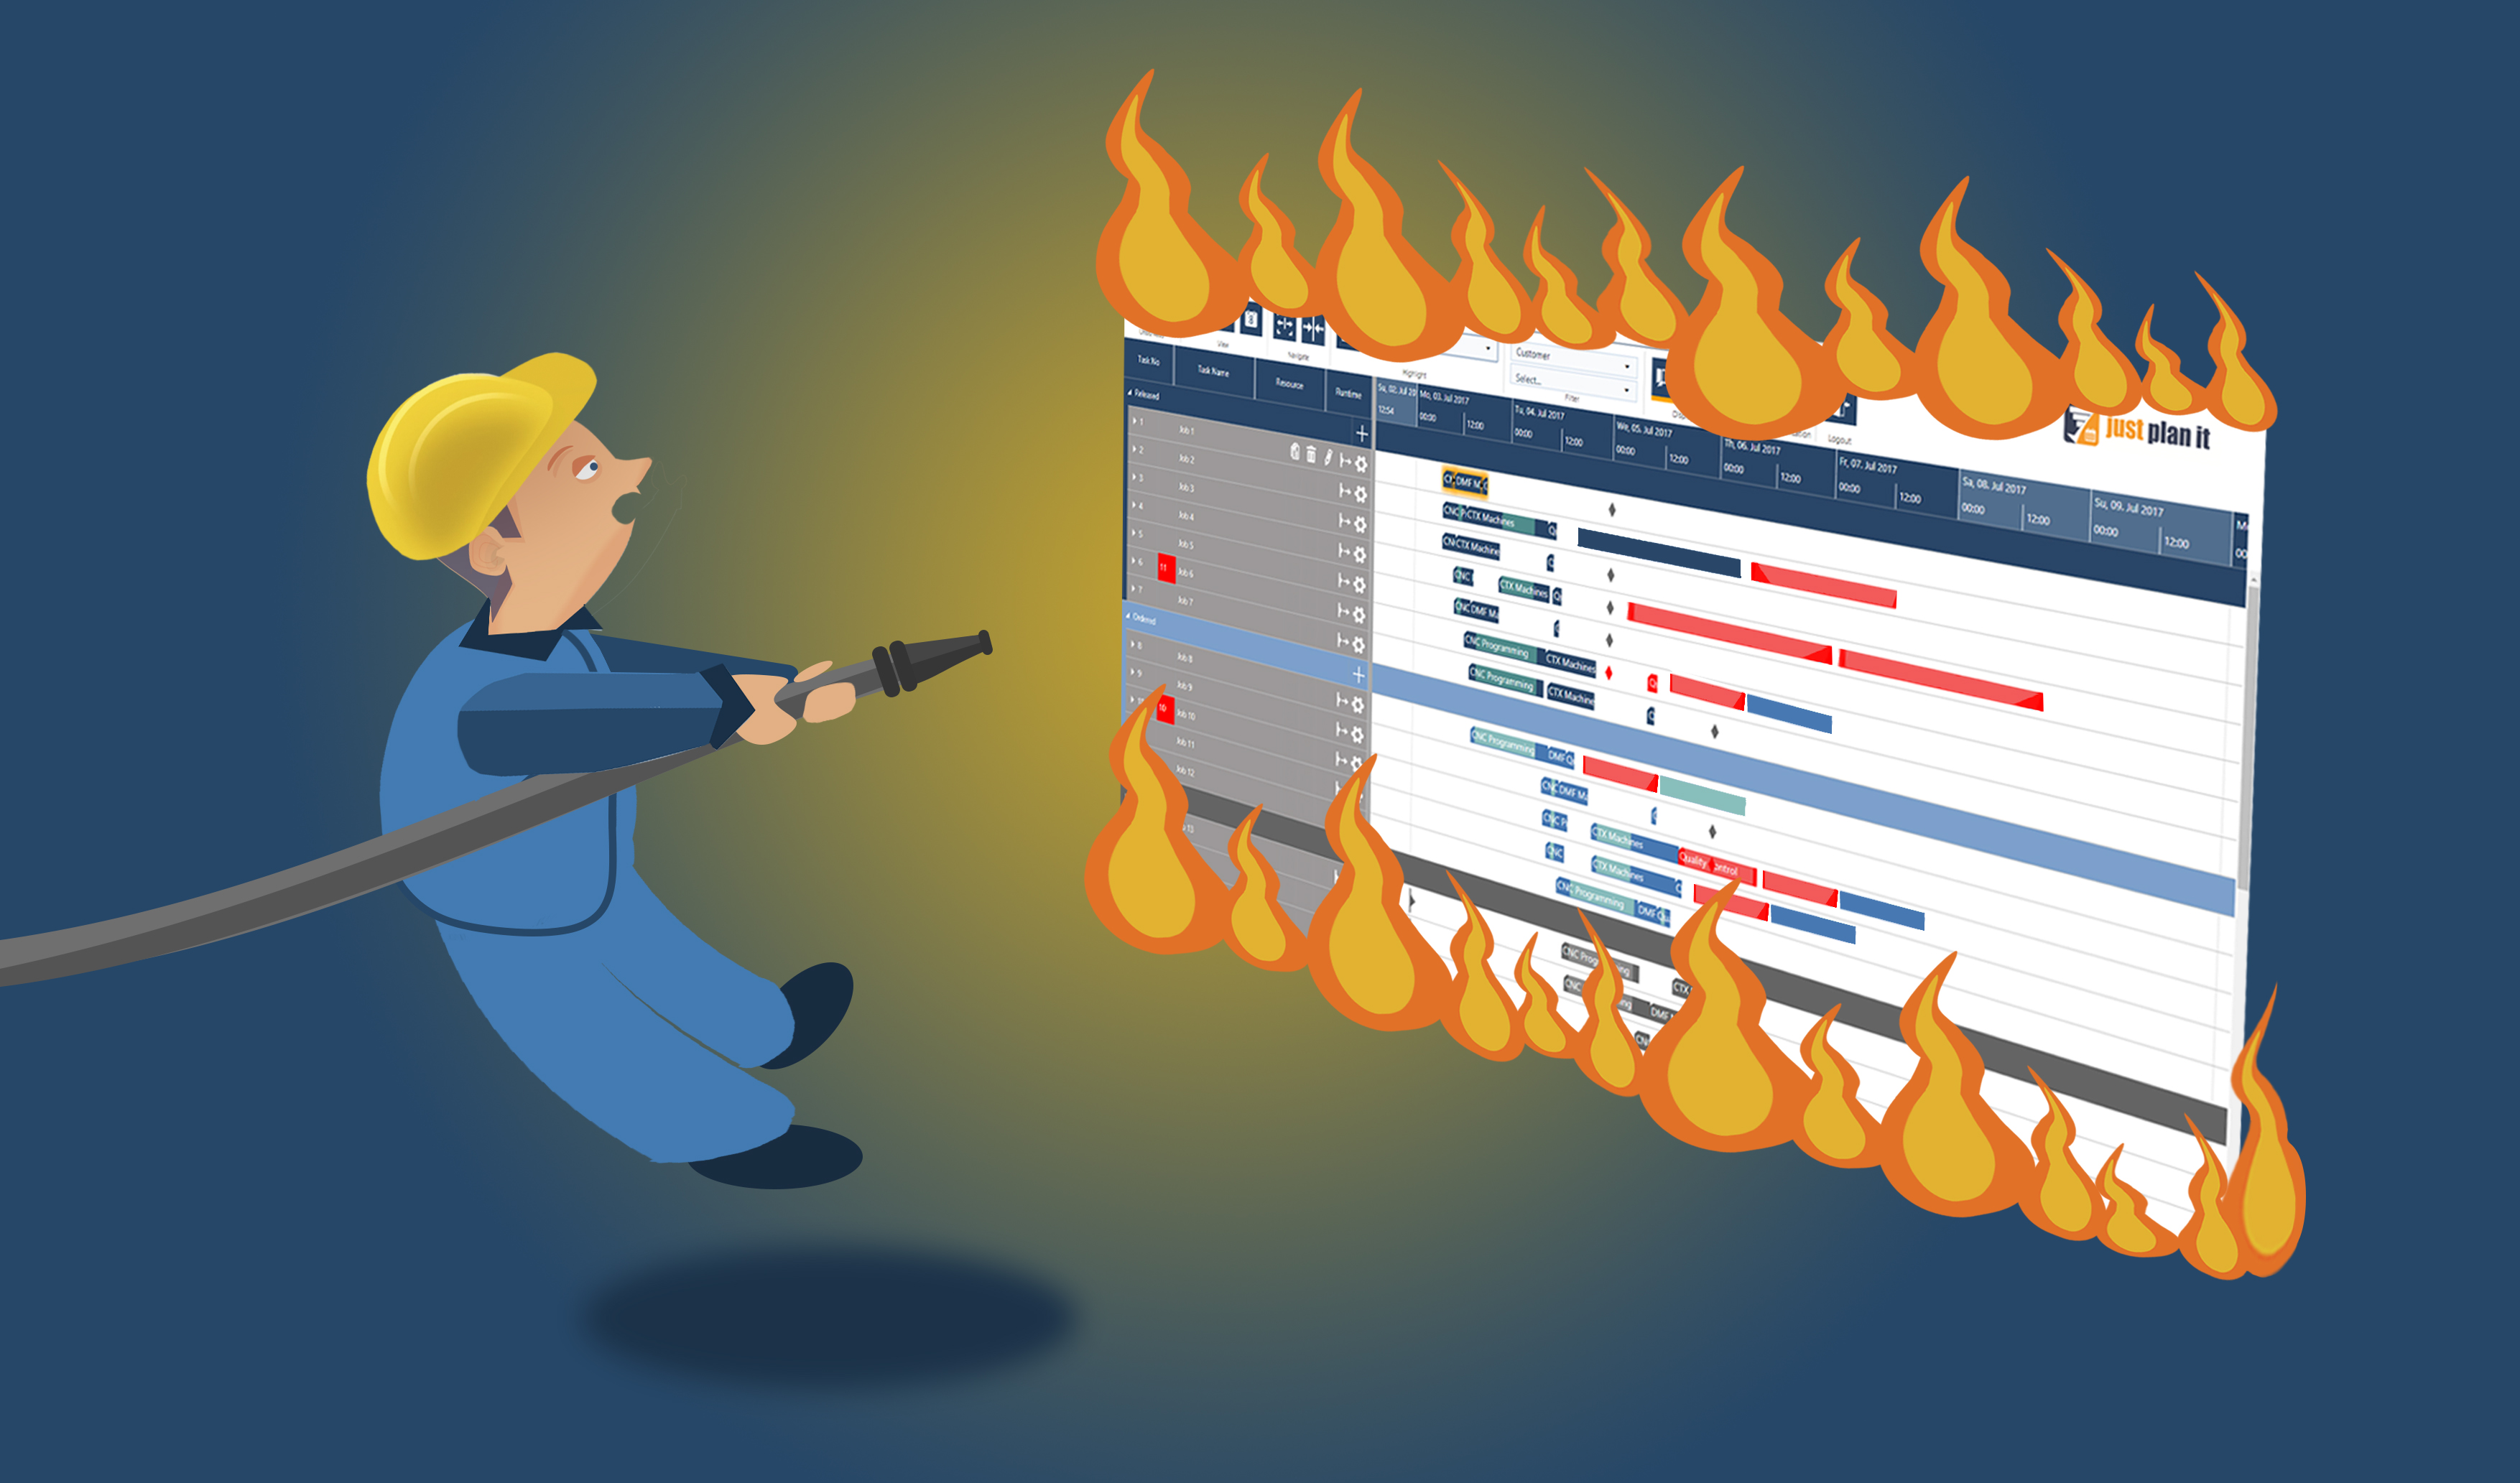
A graphical planning board displays production orders, operations, and resources in a Gantt chart, oriented to the timeline. It helps planners to interactively schedule and manage jobs and tasks. It typically shows the status of tasks or jobs, with different colors or symbols representing different stages of completion. Hence it provides all the necessary details needed for finite scheduling.
👉10 key functions a digital graphical planning board for HMLV must offer
Similar to a graphical planning board, a production dashboard serves to visualize and present data from production, but based on aggregated figures and from a much higher level. Graphical formats are such as graphs, charts, or tables. Instead of detailed information about jobs and tasks, it provides an overview of key performance indicators (KPIs) or metrics from the outcome of a business. KPIs can be revenue, sales, on-time delivery, lead time, and others, depending on the goal of the business. In larger organizations, dashboards have long been used by managers and executives to monitor production efficiency and productivity and make data-driven decisions. Monitoring KPIs is just as important in the case of small businesses to achieve a long-term profitable business, and setting up and monitoring the data with today's software tools is no longer costly either. That is why it is important for them to engage with production dashboards today.
The main elements of a dashboard are:
Today's dashboard software tools are generally customizable to meet the specific needs of the business, like the ability to add or remove KPIs, adjust data visualization settings, and set custom alerts or notifications. They usually include customizable APIs to integrate with existing production scheduling software.
High-mix low-volume (HMLV) manufacturers are very individual in regard to products and hence production processes, so key performance indicators in this production environment are difficult to define.
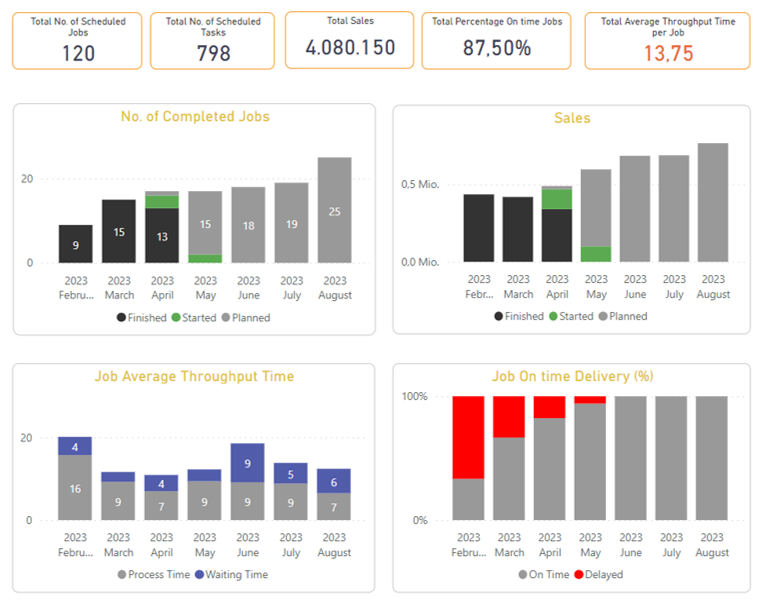
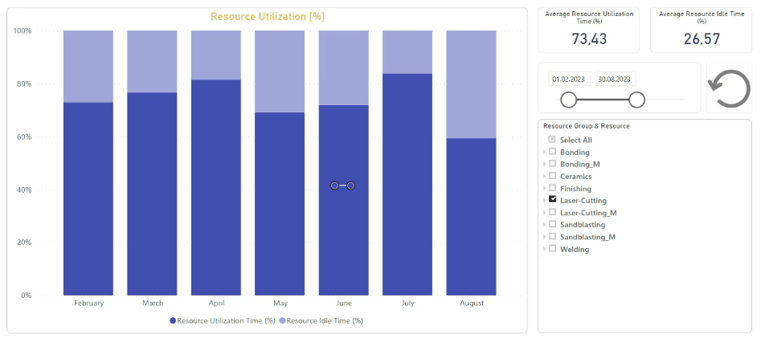
When we recently enhanced the production dashboard in our production scheduling software just plan it, we identified 4 common KPIs that are important to successfully monitor and manage HMLV production:
Other useful KPIs can be scrap & rework rates, cycle time, or inventory levels. It very much depends on the business.
Important: Only if you regularly check production against KPIs you can make continuous improvements. Therefore, job shop managers should look at the data in the dashboard on a daily or at least weekly basis in order to identify undesirable developments in production at an early stage.
🏆 The production excellence dashboard of just plan it
There are a few preliminary considerations before working with a dashboard:
1. Define your key performance indicators (KPIs): Before creating a dashboard, it's important to identify the KPIs that are most important to your business. For HMLV manufacturers we recommend the 4 KPIs OTD, WIP, Throughput, and Resource Utilization.
2. Choose a dashboard tool: Choose a tool that meets your needs and has the capability to integrate with your existing systems. For our production scheduling software just plan it we developed a data interface to PowerBI, for example, so our users can easily activate a powerful dashboard with real-time data right away.
3. Create your dashboard: visualize your KPIs in a way that is easy to understand and monitor. This could include charts, graphs, and tables.
4. Use real-time data: Ensure that your dashboard is updated in real time so that you can monitor the production process as it happens.
5. Empower your team: Make the dashboard available to your production team and empower them to use it to monitor their own performance. This will help create a culture of accountability and continuous improvement.
If you are unsure, which KPIs you need to monitor in your business, try to answer the following questions:
just plan it empowers SMB make-to-order companies and job shops to increase delivery time commitments while optimizing resource utilization. It is a visual scheduling application built specifically for HMLV production planners and SMB business owners which combines state-of-the-art automatic finite scheduling with intelligent visualization allowing agility to deal with the unknown and unexpected every day. Why not give it a try?
👨💻Get a free consultation from one of our scheduling experts
Which data are essential for production scheduling in HMLV job shops?
What production schedule do high-mix low-volume companies need to grow?
30% decrease in WIP with purpose-built software for HMLV manufacturer

just plan it is a production scheduling software plus scheduling tools & best practices to help high-mix low-volume make-to-order manufacturers gain transparency and control over their shop operations. The software plus its methodology is used by thousands of people around the globe. They consistently achieve improved on-time deliveries, shorter lead times, and better utilization of their resources.
As just plan it is not just software, but a lot of processes and best practices, we recommend that you start with an exploratory meeting. If we agree that there is a fit between your requirements and our approach, we'll build a prototype for you.
Hence, it all starts with a meeting. Book that meeting now.

Comments (3)