Menu


As of today, we re-released the updated just plan it version originally announced for the start of April. We sadly had to roll back the publishing process after the initial release, as we dramatically underestimated the impact of the update and the areas affected. For that, we wholeheartedly apologize.
We spent the last five weeks not only fixing issues reported to us by our customers, but we also heavily adjusted our internal procedures and drastically overhauled our testing routines to avoid such issues in the future. With the changes made, we also found a couple of further enhancements and additional issues that we needed to tackle to push out the release again confidently.
Again, we are very sorry for any inconvenience caused and for the delayed shipment of the performance-enhanced version. Since we were now able to achieve good and even better performance values than in our first attempt, I recommend reading the following blog post again. Of course, this also contains the current measured values for performance. Finally, as a matter of fact, it is our core target now to step back into our proven sprint cycle to bring new functionalities and improvements to you to help you in your scheduling challenge.
With this release, we finalize our current development focus on enhancing just plan its performance. We put a lot of thought and effort into enhancing jpi for all our users and strongly believe that the numbers we can present today were worth the effort. This also means that we refocus now on adding and enhancing functionalities and delivering new and useful ways for your planning. But, of course, this shift in focus does not mean, that we stop keeping an eye on our stability and performance, which are still important to us.
We started this year coming off a big release in December 2021, which allowed us to offer a lot of exciting new functionalities like pdf exports, the world view, and more. Changing our fundamental visualization engine of course needed some additional love in January, but we still developed new functionality in the form of the AutoRelease Dates. But we also started to acknowledge that we need to work on our performance, as we saw that with the complexities and features introduced in the last years and the growth of our customers' plans, we saw a decline in response times, which we set out to reduce as much as possible.
This led to us rethinking architecture and communication systems, as well as implementing intelligence to our backend to decide if changes have a small enough impact to forgo rescheduling and just updating the data model. We released the first step of this in February, including not only the update to the backend but also preparing the front-end client to reduce its load, as, especially for larger plans, updating the visualization is the most time-consuming part of an update. This first step took the same differentiation into account as the backend update, speeding up non-scheduling relevant changes.
But of course, we wanted to expand this to as many types of updates to your plan as possible. And this is where we are. Using the new foundation we build in December we are now able to significantly increase client performance. Let’s take a closer look at the last 3 months' worth of efforts:
Let me preface this: All results are measured against the January 31st release of just plan it.
To check if we are on the right track with what we are doing, we established a baseline of interactions and datasets of different sizes and complexities to measure against. We focused our measurements on the OnClient duration, meaning the time just plan it takes to render and visualize the plan to you, as except for the differentiation between non-scheduling relevant and scheduling-relevant changes, we did not have that many avenues to increase our backend calculation at this time. This means that the values presented will not represent the total time an interaction takes, but only the amount of time of the visualization. Of course, all measurements were taken on the same pc to keep them comparable.
With these ground rules out of the way let's take a look at the improvements of non-scheduling-relevant changes:
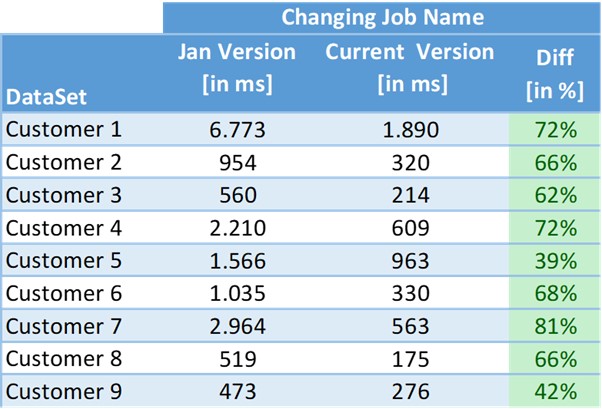
In this table, let´s focus on one non-scheduling relevant example of our measurements: “changing the job name”. In this regard, the table shows from left to right: the performance end of January, the performance with the new release, and the percent improvement. The numbers given are milliseconds. The examples were measured based on customer account data.
As you can see in most cases we more than halved the time spend on visualization and in some of the larger datasets we were even able to quarter it. Overall we increased the visualization performance for non-scheduling-relevant changes by roughly 65 % of overall changes and datasets. This is also true for other non-scheduling relevant interactions such as adjusting the additional text, changing the customer name, or changing a custom field.
While this itself is already a good result, as I alluded to earlier we did not want to focus on non-scheduling-relevant changes and did our best to improve the scheduling relevant changes as well. For this let´s focus on the example: “changing the release date of a job”.
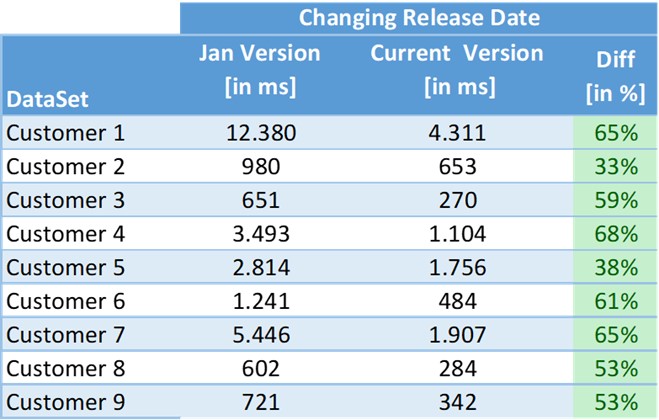
And that we did. The respective results you can see in the table again. We measured fairly similar values for other scheduling-relevant interactions - such as changing the sequence number or changing the job quantity. As the nature of scheduling-relevant changes usually needs to update a significant portion of the plan, the performance increase is not quite as significant as with the non-scheduling-relevant changes, but I would say an average increase in performance of more than 40% is nothing to scoff at. Also as you might have guessed the larger and more complicated your plan is, the higher the potential performance increase will be.
Watch the recorded webinar from May 24, 2022, when we present all performance improvements live
We are proud of what we have been able to achieve with this release, increasing the visualization performance on average between all datasets and interactions by roughly 53%, and are looking forward to your feedback and now refocusing on adding new functionality. Speaking of which:
The next sprint will focus on adding the first step into the foray of an often requested feature what we internally call “Team planning”. The corresponding functionality will help to master scheduling challenges where tasks are operated by several manpower resources and where the amount of people assigned to a task defines the lengths of the runtime.
We will also start the groundwork for another longer-term project we will reveal at a later time. And of course, as always we will include bug fixes and smaller enhancements.
We plan to release the next sprint on June 20th.
That’s it for today.
As always we are happy and eager to receive any feedback from you guys and to answer any questions you may have.
Until then,
Happy Scheduling!
You aren't a just plan it user so far? Why spend more time on maintaining an inappropriate self-made stopgap solution? Why waste more money due to a lack of shopfloor transparency?
Book your meeting with a scheduling specialist now and see how easy you can improve your scheduling by just plan it:

just plan it is a production scheduling software plus scheduling tools & best practices to help high-mix low-volume make-to-order manufacturers gain transparency and control over their shop operations. The software plus its methodology is used by thousands of people around the globe. They consistently achieve improved on-time deliveries, shorter lead times, and better utilization of their resources.
As just plan it is not just software, but a lot of processes and best practices, we recommend that you start with an exploratory meeting. If we agree that there is a fit between your requirements and our approach, we'll build a prototype for you.
Hence, it all starts with a meeting. Book that meeting now.

Comments (1)