Menu


A new release of our production scheduling software just plan it for high-mix low-volume manufacturers was released today. With the new version, we focused on enhancing the automatic finite scheduling capabilities. In particular, we are very happy to offer “Task Connection” functionality to our customers. Additionally, we also extended the options to customize the KPIs shown in the Job View.
Put simply, task connection functionality allows you to connect two tasks strictly with each other. This implies that the just plan it scheduling engine automatically takes care that there is never any waiting time between two connected operations. As part of this release, we have focused on the most common use case of linear task connection structures in the first step. This means that the connected operations need to be in a linear predecessor-successor relationship. In addition, the non-working time of finite resources is considered when connecting tasks.
The following graph illustrates the functionality and separates the desired from the avoided behavior.
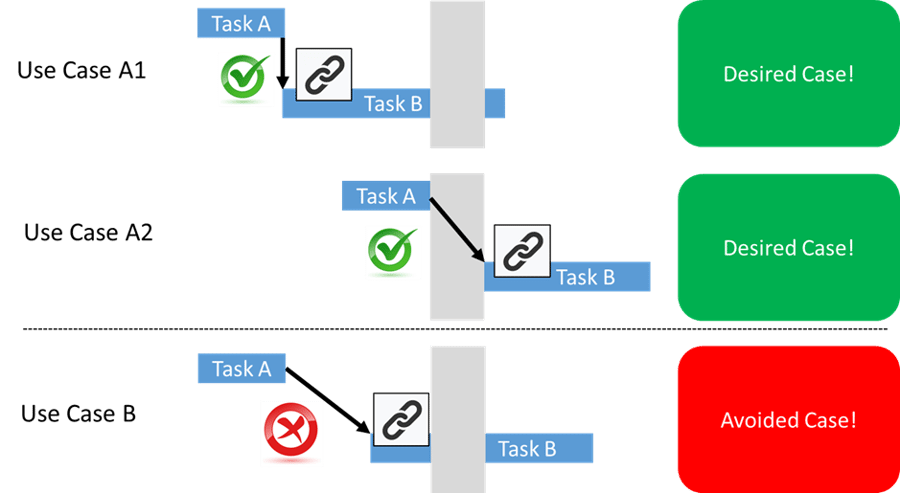
Use Case A1 shows the desired connection between Task A and Task B. As the 90-degree angle of the link implies there is no waiting time at all and Task B is scheduled to start exactly when Task B ends. Also, when the sequence number of the respective job is decreased the task connection will take care of this desired connection consequently.
Since finite resources may have non-productive times, task A may end exactly at the beginning of a non-productive time window. As non-productive times of the calendars aren’t waiting times use case A2 also shows a desired case for connecting Task A and Task B.
For the sake of completeness, use case B shows a condition that will never occur when using Task Connection as there is waiting time between stages A and B.
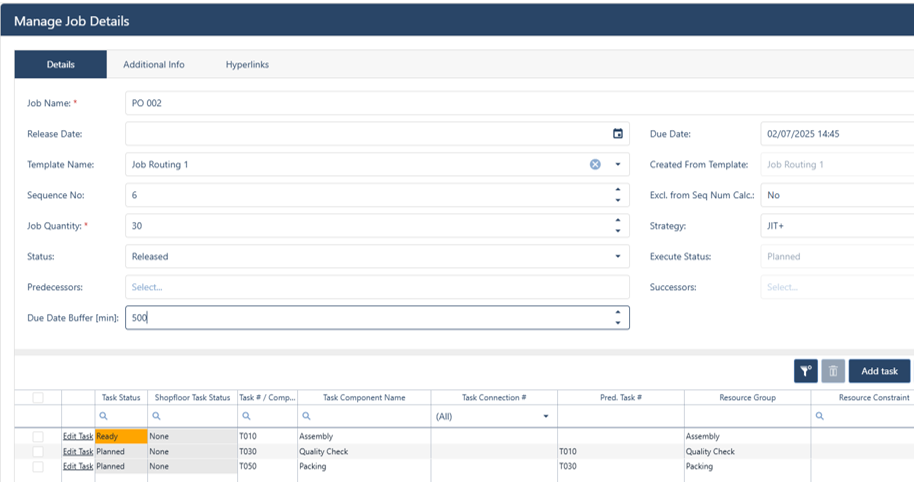
The most common use case is for sure that an operation is divided into two parts with different resource requirements. E.g. a setup process and the actual production process. It stands to reason that the production process always starts immediately after the setup is completed, without any other operations intervening. Let´s take an example: there is a laser cutting operation that requires only one operator for setup, and then the machine can run the process on its own. In just plan it you model this as follows:

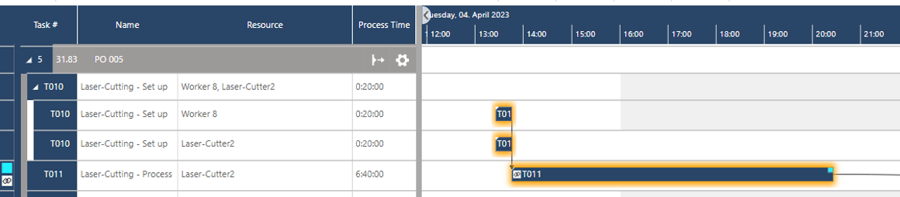
As you can see: task connections are visualized both on the left side of the respective bar and in the symbol columns of the Gantt chart by showing the “link icon”.
Another use case for task connection is that operations are coming along with strict expiry dates of products. This implies that once a job is started it must be progressed continuously as any waiting or storage times aren’t an available option. In this case, you just need to connect all tasks of the entire routing.
Last but not least please note that you – as a matter of fact – also can upload Task Connections, as we have extended our xls upload and API capabilities accordingly.
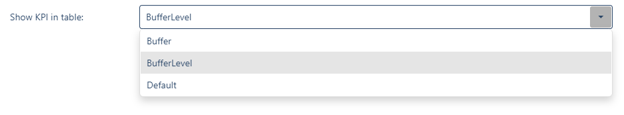
Formerly on the left side of the table part of the Job View, we showed the (negative) buffer value only in case a job was scheduled to be late. For all on-time jobs, no value was shown. This is also extended with the new version. Via “Settings” and “Show KPI in Job View” you can define whether you
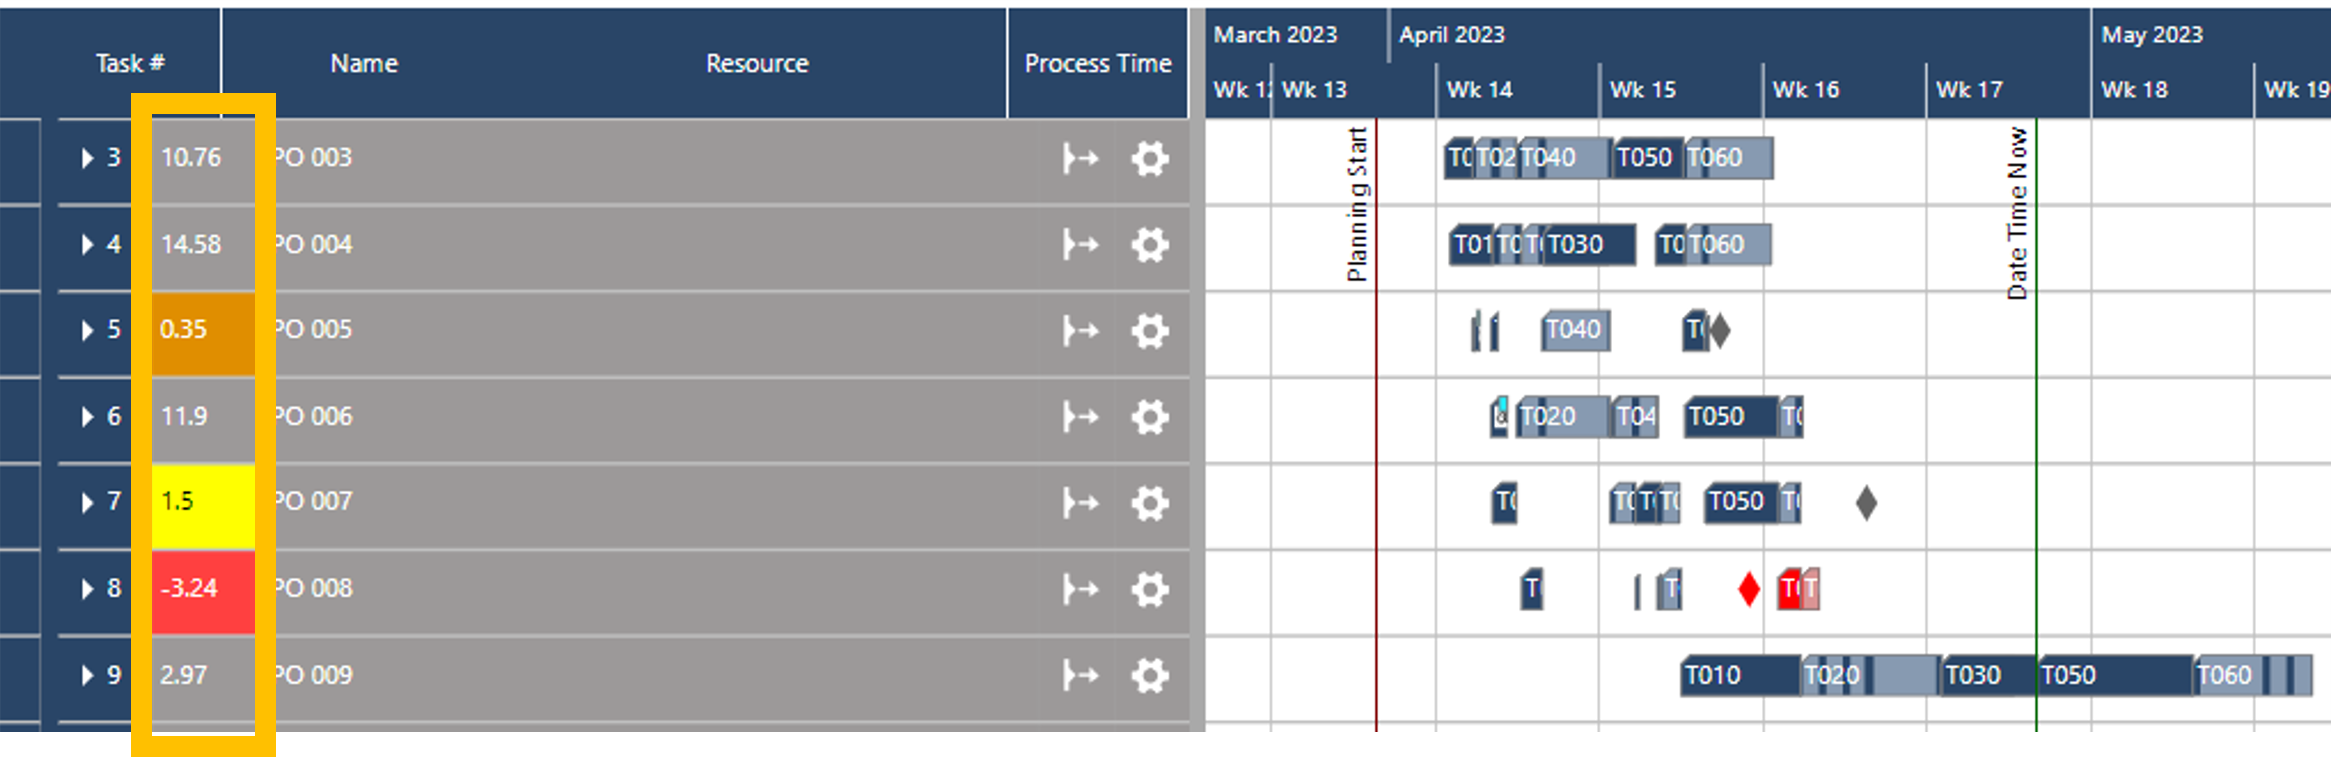
The screenshot above shows the buffer level for all jobs in the left part of the table in the Job View. Independently from your selection, we kept the coloring of the respective cell related to the buffer level value always.
You can find all blog posts about our releases in product news. Each release is accompanied by a webinar that you can watch on-demand on our YouTube Chanel.
just plan it is a production scheduling software plus scheduling tools & best practices to help high-mix low-volume make-to-order manufacturers gain transparency and control over their shop operations. The software plus its methodology is used by thousands of people around the globe. They consistently achieve improved on-time deliveries, shorter lead times, and better utilization of their resources.
As just plan it is not just software, but a lot of processes and best practices, we recommend that you start with an exploratory meeting. If we agree that there is a fit between your requirements and our approach, we'll build a prototype for you.
Hence, it all starts with a meeting. Book that meeting now.
No Comments Yet
Let us know what you think