Menu


I'm excited to share with you four new functions that our developers have been working on the past couple of weeks. We've expanded functionality with two new resource capacity planning tools and two usability enhancements.
With respect to resource capacity planning, we've added a capacity report to our visual production scheduling software while simultaneously adding a new set of criteria to the color schemes designer so that you can easily build a bottleneck-centric color scheme.
In addition, we made just plan it capable of storing your last screen settings meaning that upon your next log in, the software will exactly look as it did when you logged out before. And last but not least, we added a time picker to every date picker so that from now on you not only can specify e.g. a due date, but also the due time for a job. The good news is: all new functions are available for BASIC, PRO and ENTERPRISE customers.
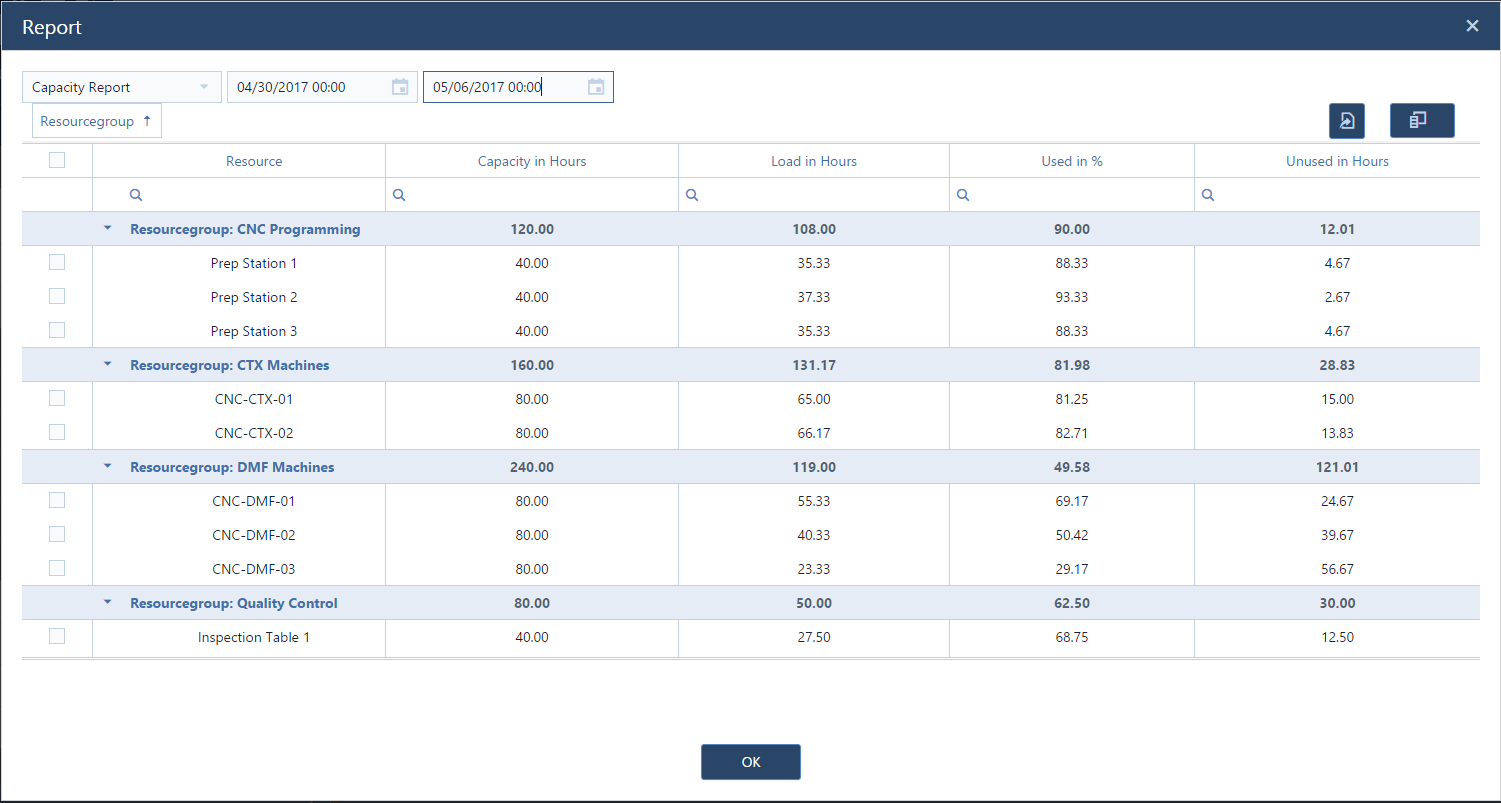
We complemented the reporting capabilities by adding a capacity report to the already existing job and task reports. You can open it from the Import/Report tab and the "generate reports and export to Excel" button. Once opened, you'll then select a timeframe for which you want to run the capacity report. The report then shows you by resource group (as totals) and resources the following information:
As such, the capacity report looks as follows:

Of course, you can then export the capacity report to Microsoft Excel. I am confident that you'll be using this feature a lot as useful resource capacity planning tool.
A few weeks ago, we introduced the enhanced job report with a bunch of new metrics such as buffer, waiting time, etc. Waiting time espially being an interesting piece of information: defined as total throughput time minus total non-working time minus total runtime minus total transfer time. Hence, the waiting time tells you the total time (starting at the planned start date) that this job has to wait due to other jobs having a higher priority.
Generally spoken, waiting time is not a bad thing. If you - literally! - look at this from the Resource View (means from the perspective of your machines), it is the waiting time that helps achieving a high utilization of your resources, with one task lining up after the other. If there is just waiting time, it tells you that you seem to have a solid amount of orders to keep your resources busy. However, this can turn into a dilemma, if you have jobs with waiting time that run late. In that case, waiting time feels like "wasted time" and then turns into an indication of a bottleneck in your production flow.
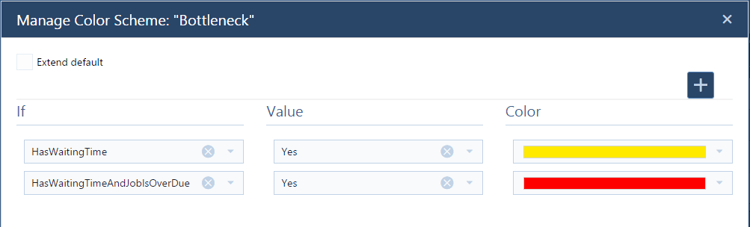
With just plan it, you now have the capability to define color schemes with which you highlight tasks that have a waiting time (= queueing tasks, indicating a potential bottleneck). In addition to this, you also can highlight those tasks that have a waiting time and belong to jobs which finish past the due date (= bottleneck). Below is a screenshot of a color scheme that I defined using these two new properties.
Applying this color scheme to my schedule yields the following result.
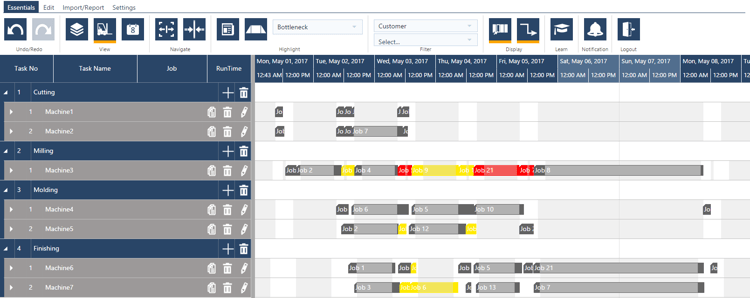
You now see that some tasks are yellow and some are red. Yellow means that they have just waiting time, and red shows that they have waiting timr and belong to a job which is past its due date. So you can see that there are some machines which are at almost 100% capacity utilization with some tasks waiting before they can be processes. Nothing bad in general. However, there is one machine (milling), where you can see both yellow and red bars. That means, you not just have waiting times, but also waiting times leading to delays with respect to the job's due date. A picture like this indicates that milling is the bottleneck on this shop-floor.
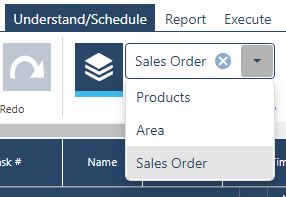
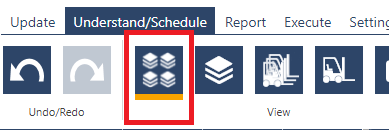
In terms of usability enhancements, here is something that our developers refer to as "LocalStorage". Sounds boring? Is exciting. From now on, we store a lot of visual "settings" that you have on the screen and keep this information so that next time you log into the software, it looks almost exactly like on your last log out. Here are some examples that we remember:
Here is a short video demonstrating the effect.
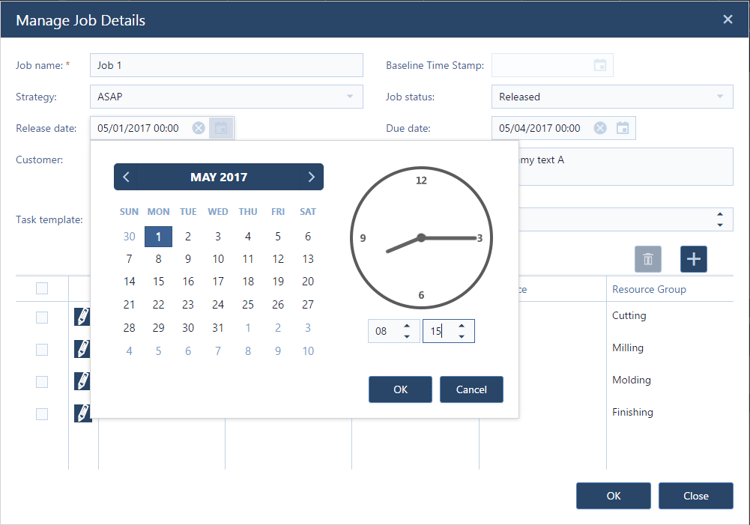
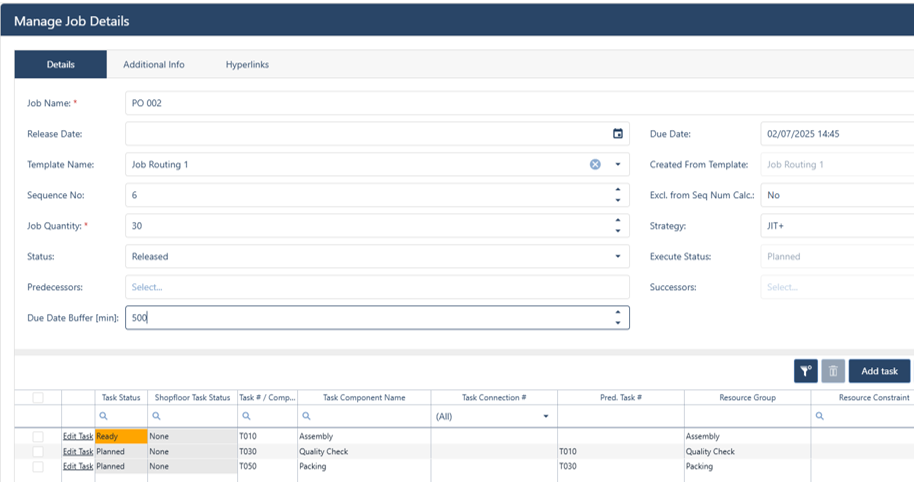
Last but not least, we added a time picker to all date pickers. Think this is "only" developer language? Have no clue what I mean? Well, everywhere in the software, where you could previously define a date (e.g. a due date), you now also can define a time (e.g. a due time). Here is how this looks:
That's all for now. More to come ...
And by the way, if you aren't using or testing just plan it at the moment, why not give it a try? The 30 days trial is free-of-charge and we are happy to provide you with any support needed.
just plan it is a production scheduling software plus scheduling tools & best practices to help high-mix low-volume make-to-order manufacturers gain transparency and control over their shop operations. The software plus its methodology is used by thousands of people around the globe. They consistently achieve improved on-time deliveries, shorter lead times, and better utilization of their resources.
As just plan it is not just software, but a lot of processes and best practices, we recommend that you start with an exploratory meeting. If we agree that there is a fit between your requirements and our approach, we'll build a prototype for you.
Hence, it all starts with a meeting. Book that meeting now.

No Comments Yet
Let us know what you think