Menu


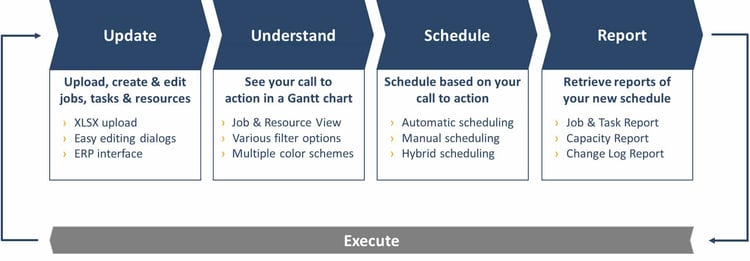
The focus of our just plan it software is (and remains) on enabling small job shops and small make-to-order companies with an easy time and resource scheduling. Nevertheless, we learned that a solid level of reporting capabilities definitively cannot hurt when trying to achieve a proper scheduling. Hence, our visual production planning software already comes with a basic Job Report and a basic Task Report which both can be exported to Microsoft Excel at any time. We now enhanced the Job Report in a way that it (a) contains new metrics concerning throughput, buffer and waiting times and that it (b) allows a comparison between the current schedule and the schedule's baseline.
As of today, we enhance the Job Report of our visual production planning software by the following metrics:
I am pretty confident that these metrics might help you making your job-related reporting and data crunching more meaningful. Here is a snapshot how this might look like (the sample shows a filter on the released jobs). Please also have a look where I "find" the new metrics and how I pull them into the Job Report.
just plan it is designed to provide you with a lot of scheduling and data agility. However, we also know that there is this one "moment of truth" in which you want to nail your job's schedule - at least to have a reference point for reporting purposes. This is what we call the baseline.
Definition:
The baseline is the approved initial schedule of your job. With setting a baseline, the job should move from scheduling to execution. Hence, the baseline gives you some great information to control the job, and to measure execution.
We actually allow you as of now to save (all in one go) the following baseline information per job:
All of the above baseline metrics are available within the enhanced Job Report. As such, you can export them to Microsoft Excel and build some meaningful reports and analytics to better manage your job shop schedule.
I sense that these new metrics bear some great potential to improve the insight into your job shop schedule. Here are some introductory ideas:
The above are just a few examples what you can achieve with the new metrics that we provide you with via the enhanced Jobs Report. I suggest that you export your job shop schedule to Excel, and play around with these metrics a bit further. They definitively have the potential to unveil new insights.
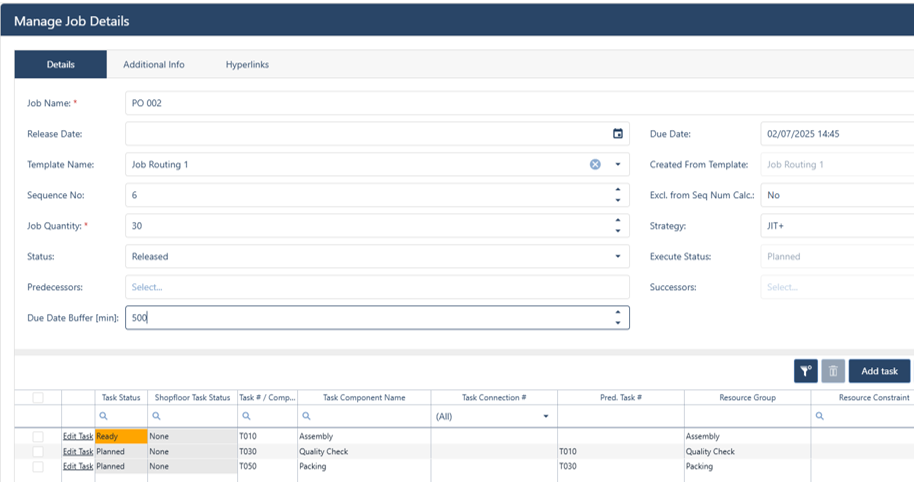
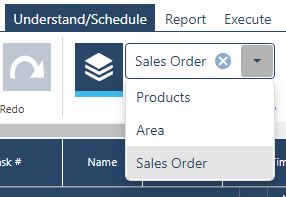
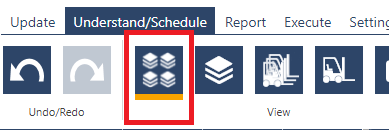
 Now that you know which additional capabilities we just made available for you, I thought wrapping this post up with sharing how to achieve this. In the Import/Report tab you find the icon shown left. With pressing this button, you set a baseline for all jobs that did not have a baseline before. Here is a word of caution: you cannot undo this, and you can set baselines for multiple jobs only once. If you press the button, there is no way back. I strongly recommend that you press this button once in an active session - before you are about to log out of our visual production scheduling software. If you want to be 100% sure for which jobs you will set the baseline, go to the Job View and filter on all jobs without a baseline yet. They all will receive a baseline with hitting the button. When doing so, we also set a time stamp called "date when baseline was set". We show you this data - for information purposes only - in the "Manage Job Details" dialog.
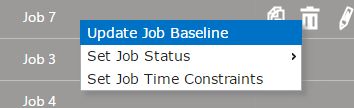 Well, there might be cases, in which you just want to update one already existing baseline for one dedicated job. This can be achieved by right clicking on the job in the table part of the Job View. This opens a dialog in which you can see the previous baseline and the new values as they are currently planned in your schedule. You cannot change these values in the dialog, but just confirm that you want to update the baseline accordingly.
Last but not least, I can assure you that there is more to come (the team is working to complete a new capacity report soon) and that I will keep you posted. If you do not yet work with just plan it, why not giving it a try? It is free for 30 days and provides you with a plethora of visual production planning capabilities.
just plan it is a production scheduling software plus scheduling tools & best practices to help high-mix low-volume make-to-order manufacturers gain transparency and control over their shop operations. The software plus its methodology is used by thousands of people around the globe. They consistently achieve improved on-time deliveries, shorter lead times, and better utilization of their resources.
As just plan it is not just software, but a lot of processes and best practices, we recommend that you start with an exploratory meeting. If we agree that there is a fit between your requirements and our approach, we'll build a prototype for you.
Hence, it all starts with a meeting. Book that meeting now.
No Comments Yet
Let us know what you think