free trial  log in

just plan it - production excellence dashboard

Production Excellence Dashboard

Get meaningful production KPIs at one glance with powerful drill down capabilities. Track your shop's velocity, shopfloor progress, throughput and on-time delivery with one dashboard.

Get demo

Control the performance of your shop at a glance

Get a high-level view on what has happened on your shopfloor, what is happening and what will happen.  With just plan it, you have an effective tool to schedule your jobs, tasks and workload. And with the Execute functionality, you also know what is going on in your shopfloor. By tracking shopfloor feedback, just plan it also has massive data about your past execution. The production excellence dashboard turns this data into insights:

  • Based on high level aggregated figures
  • Based on manufacturing KPIs (OTD; WIP; Throughput; Resource Utilization)
  • With capability to drill down into lowest tasks level
  • With capability to show the entire timeline of historical data

The just plan it dashboard is a PowerBI template that you can use out-of-the-box instantly. But you are also able to further finetune the dashboard on your own if you have the skills to do so. Alternatively you can also provide your requirements for customization to us. We will offer the realization on a time- and material-base.

With the just plan it dashboard, managers get a clear view of the shops performance at a glance. With the just plan it dashboard managers take intelligent decisions.

Requirements

  • just plan it - Scheduling
  • just plan it - Execution
  • Microsoft PowerBI

Publisher

  • NETRONIC Software

Learn more

just plan it & PowerBI

app - production excellence dashboard - screenshot-01
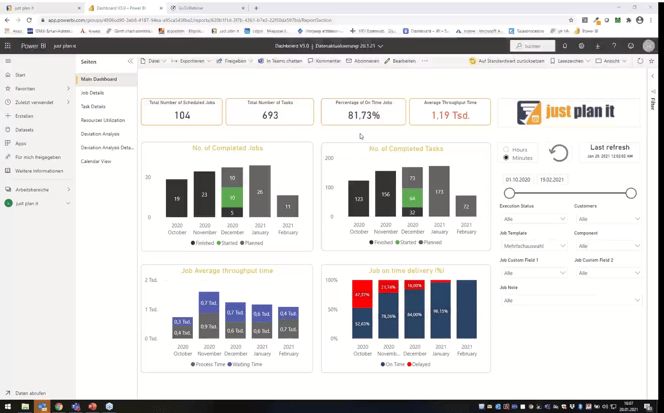
Get real-time access to meaningful production KPIs

The production excellence dashboard syncs your just plan it production scheduling data with Microsoft PowerBI. 

As such, it combines the wealth and depth of your production data with the all drill-down and filtering capabilities of PowerBI.

The screenshot shows the entry-level dashboard which shows key KPIs on the velocity of your shop, the execution status, your throughput and resource utilization and the development of your on-time deliveries.

Of course, you can drill-down into any aspect of the entry-level dashboard.


app - production excellence dashboard - screenshot-02
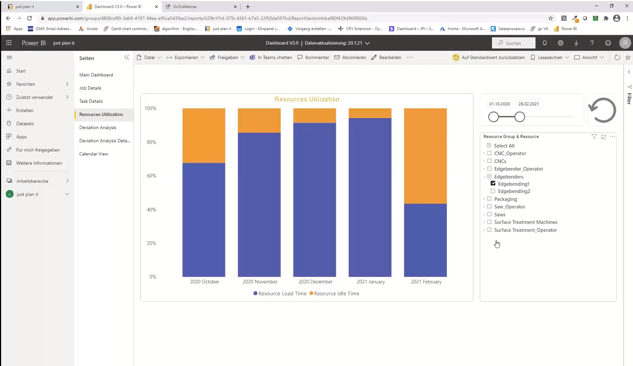
Better resource utilization = better throughput

Monitor and manage your resource utilization over time. This gives you a clear understanding why you had different levels of throughput in previous months, quarters, of even years.

The screenshot shows the monthly utilization and represents what you can achieve with a proper use of just plan it: more utilization time (purple) and less idle time (orange). 

It also shows you that your backlog for the upcoming month is too low, and that you have to have an eye of new order intakes.


app - production excellence dashboard - screenshot-03
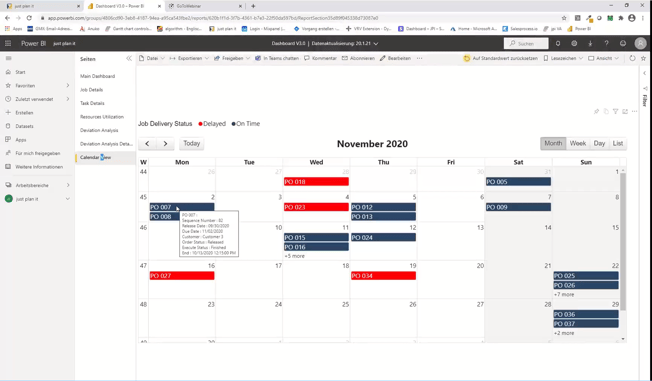
On-time deliveries - by week and shipment dates

Drill-down into your jobs, when they are due and when they are planned to get finished.

Identify late jobs and late shipments (red) at one glance.

With the calendar-style view, you and easily understand how your on-time deliveries develop over time (and you can drill into the single jobs to get even more data).


See the production excellence dashboard in action:

Want to lean more about the production excellence dashboard?

GET A PRICE!